


![acquisition three jigsaw]](https://d17mj6xr9uykrr.cloudfront.net/Pictures/274x183/4/9/8/122498_acquisitionthreejigsaw_905211.jpg)


A new report from Insurance DataLab has collated claims, complaints, solvency and underwriting data into a single framework designed to give brokers a broader view of insurer performance
Brokers are facing growing pressure to justify why they place business with particular insurers as claims performance, complaints handling and customer outcomes move higher up the regulatory agenda.

That is one of the reasons behind Insurance DataLab’s new Insurer Performance and Conduct Report, launched at the Biba Conference in May.
The report introduces the Insurer Performance Index, which combines claims, complaints, solvency and underwriting data into a single framework designed to give brokers a broader view of insurer performance and customer outcomes.
The report analyses insurers representing more than £72bn of gross written premium and draws on data from sources including the FCA, Financial Ombudsman Service (FOS), Consumer Intelligence and Insurance DataLab’s inaugural Commercial Lines Claims Pulse survey.
Explaining the need for the report, Insurance DataLab co-founder Dan King said brokers increasingly need a more rounded way of assessing insurer performance.
“The market has more data available than ever before, but much of it sits in silos and is difficult to interpret consistently,” he said.
“What we wanted to do with the Insurer Performance Index was bring together the areas that matter most to brokers and customers – claims, complaints, solvency and underwriting – into one framework that provides a clearer picture of how insurers are actually performing in practice.”
The report comes as brokers face increasing scrutiny around evidencing customer outcomes under Consumer Duty, with firms expected to demonstrate not only fair pricing and suitable cover, but also confidence in the insurers they recommend.
A key differentiator
Claims handling emerged as one of the clearest differentiators across the market.
Read: The most complained about business lines in UKGI
Read: Almost two years on – has Consumer Duty improved customer outcomes?
Explore more Data Matters content here, or discover other news analysis stories here
Insurance DataLab’s Commercial Lines Claims Pulse survey, conducted in partnership with Research in Finance and based on more than 800 claims experiences, found brokers who had a positive claims experience were almost 10 times more likely to place business with that insurer again.
Meanwhile, 78% of brokers said trust in an insurer declined following a poor claims experience, while 39% said they would be unlikely to place business with that insurer afterwards.
Writing in the report, Biba chief executive Graeme Trudgill said: “Insurance brokers have to demonstrate good outcomes and they very much value those insurers that stand up in times of need. This core issue is more important now than ever before.”
He added: “The claims experience and ultimate outcome remain fundamental in brokers’ thinking – brokers know who the most co-operative insurers are and how this influences future placement decisions.”
The report also highlights significant variation in claims outcomes between business lines.
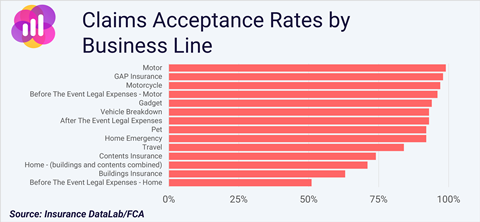
Motor insurance remains the strongest-performing area of the market, with 99% of claims accepted in the latest FCA value measures data.
Property insurance, however, presents a more mixed picture.
Buildings insurance recorded a claims acceptance rate of just 63%, while home before-the-event legal expenses cover had an acceptance rate of only 51%.
Insurance DataLab found all four of the lowest claims acceptance rates in the market related to home insurance products.
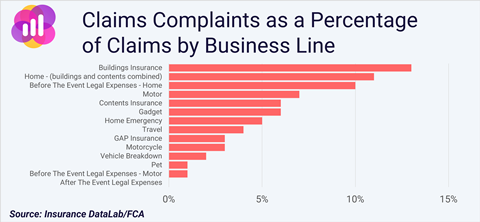
Claims complaints also remain elevated in property lines. Standalone buildings insurance recorded 13% of claims leading to a complaint about the claims process, while the figure stood at 11% for combined buildings and contents cover. This compares to just 1% for pet insurance.
King said the variation in outcomes reinforced the need for brokers to look beyond headline market averages.
“Headline market averages can look relatively healthy, but underneath that there is a huge spread of outcomes depending on insurer and business line,” he noted.
“In some parts of the market, particularly property, there are very large differences in claims acceptance rates and complaints levels between providers.
“That has direct implications for customer outcomes and for brokers’ own regulatory exposure.”
Complaints expose variation
The report found that complaints data continues to reveal wide differences in customer outcomes across the market.
Across all business lines, insurers reported an average of around 2.5 complaints per 1,000 policies, although the spread ranged from fewer than one complaint per 1,000 for some insurers to more than 70 complaints per 1,000 for the worst performer.
Internal complaints upheld in favour of customers averaged roughly 46% across the market.
Claims remain the dominant source of disputes escalated to the Financial Ombudsman Service, accounting for 71% of all cases.
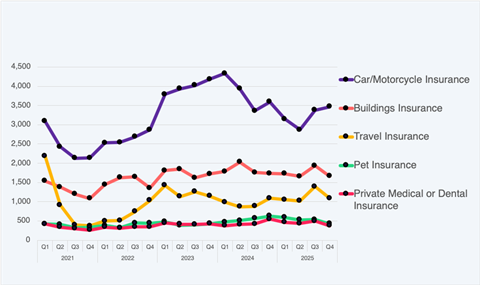
Motor insurance is still the most complained-about product line, generating 12,860 FOS complaints during 2025, equivalent to almost a third of all cases referred.
Travel insurance complaints increased by 18.9% year-on-year to 4,553 cases, making it one of the fastest-growing complaint categories in the market.
Pet insurance also continued to attract elevated complaint levels, with upheld rates reaching 45%, second only to commercial property insurance.
Financial resilience still matters
Despite the growing focus on customer outcomes, the report stresses that solvency remains a critical consideration for brokers assessing insurer partners.
Read: FOS complaint levels climbing despite Consumer Duty reforms
Read:Green shoots in packages and specialist segments amid commercial lines premium slump
Explore more Data Matters content here, or discover other news analysis stories here
However, it warns that headline market resilience masks significant differences between firms.
While some insurers reported solvency coverage ratios several multiples above minimum requirements, two insurers in the study fell below the regulatory minimum of 100%.
A similar spread was found in underwriting performance, with around seven in 10 insurers analysed reporting an all-lines combined operating ratio below 100%, although results ranged from below 50% to more than 200%.
King said the insurers standing out in the market are increasingly those able to combine financial resilience with strong operational delivery.
“A strong capital position is clearly important, particularly in volatile or long-tail classes, but solvency on its own does not tell you how well an insurer is delivering for customers,” he said.
“The insurers standing out in this report are those combining financial resilience with strong claims delivery and customer outcomes.”
Recommended insurers
Insurance DataLab identified nine insurers as Recommended Insurers under the new framework, awarded to firms achieving a green overall rating – awarded to the top 25% of the market – while maintaining at least amber ratings across all four pillars, meaning they rank in the middle 50% of insurers.
Simplyhealth is the top-rated recommended insurer with an overall index score of 822. The medical specialist performs strongly across all four pillars, with a complaints score of 885 – the second highest in the dataset – providing a key driver of its overall ranking.
This performance was driven by a low FCA complaints volume of just 0.94 per 1,000 policies against an average of 5.82, with an above-average upheld rate of 35%. The insurer also reported a market-leading Financial Ombudsman Service upheld rate for medical expenses of 9%, alongside just 12 complaints referred to the ombudsman in 2025.
Claims performance is also positive, with a score of 803, reflecting consistently high acceptance rates and minimal dispute levels.
The insurer was rated particularly highly for its capital position, earning a solvency score of 927 and placing it just outside the top 10% of insurers in this analysis. Underwriting is comparatively weaker, with a score of 639 and an Insurance DataLab Underwriting Rating of 65.3%, although this was still enough to earn the insurer an amber rating.
AIG ranked second and was the highest-rated multiline insurer with an index score of 789, driven by consistently strong customer outcomes.
The insurer’s strongest area is complaints handling, with a score of 884, the third highest in the dataset. FCA complaint volumes are notably low at 0.27 per 1,000 policies, well below the market average.
Recent half-year data shows further improvement, with complaints per 1,000 falling from 0.32 in H2 2024 to 0.21 in H1 2025, while eight week resolution rates improved to more than 99%.
Upheld rates remain broadly stable at around 48%, slightly above the market average, indicating that low volumes, rather than outcomes, are the primary driver of this performance.
Claims performance is also strong, with a score of 802, reflecting strong broker satisfaction and consistent claims delivery. AIG ranks fourth in the inaugural Insurance DataLab Claims Pulse, with broker satisfaction at 83%.
AIG earns an underwriting score of 794 with a 68.5% Insurance DataLab Underwriting Performance Rating and a solvency score of 676.
Other recommended insurers include Starr International (Europe) with an index score of 772, Alwyn (768), Sabre (764), Acromas (736), AA Underwriting (713), Highway (705) and Hiscox (702).
Methodology
The Insurance DataLab Insurer Performance Index gives a standardised view of insurer performance across four pillars – claims, complaints, solvency and underwriting.
For each pillar, insurers are assessed using a defined set of underlying metrics. Individual metrics are converted into percentile rankings relative to the peer group to ensure comparability across the dataset.
These scores are then combined using a weighted average and converted into a pillar score out of 1,000.
The overall Index Score is calculated as a weighted average of the four pillar scores, producing a single comparable score of insurer performance relative to peers.
A RAG rating is also applied for each pillar and the overall Index Score, with insurers awarded either a red, amber or green classification depending on their relative performance as follows:
- Red – bottom 25% of insurers
- Amber – middle 50% of insurers
- Green – top 25% of insurers
The solvency RAG rating is based on Solvency UK regulatory thresholds, with green for SCRs above 125%, amber for between 100% and 125% and red for those insurers with an SCR below the 100% regulatory minimum.
Building on the RAG framework, insurers that achieve a green rating for their overall Index Score are recognised as Insurance DataLab Recommended Insurers, provided they achieve at least an amber rating across each of the four individual pillars.
- The full report can be downloaded at Insurance DataLab’s website


No comments yet